300 European neuroscientists are unhappy. If 50,000,000 Frenchmen can’t be wrong, can the neuroscientists be off base? They don’t like that way things are going in a Billion Euro project to computationally model the brain (Science vol. 345 p. 127 ’14 11 July, Nature vol. 511 pp. 133 – 134 ’14 10 July). What has them particularly unhappy is that one of the sections involving cognitive neuroscience has been eliminated.
A very intelligent Op-Ed in the New York Times 12 July by psychology professor, notes that we have no theory of how to go from neurons, their connections and their firing of impulses, to how the brain produces thought. Even better, he notes that we have no idea of what such a theory would look like, or what we would accept as an explanation of brain function in terms of neurons.
While going from the gene structure in our DNA to cellular function, from there to function at the level of the organ, and from the organ to the function of the organism is more than hard (see https://luysii.wordpress.com/2014/07/09/heres-a-drug-target-for-schizophrenia-and-other-psychiatric-diseases/) at least we have a road map to guide us. None is available to take us from neurons to thought, and the 300 argue that concentrating only on neurons, while producing knowledge, won’t give us the explanation we seek. The 300 argue that we should progress on all fronts, which the people running the project reject as too diffuse.
I’ve posted on this problem before — I don’t think a wiring diagram of the brain (while interesting) will tell us what we want to know. Here’s part of an earlier post — with a few additions and subtractions.
Would a wiring diagram of the brain help you understand it?
Every budding chemist sits through a statistical mechanics course, in which the insanity and inutility of knowing the position and velocity of each and every of the 10^23 molecules of a mole or so of gas in a container is brought home. Instead we need to know the average energy of the molecules and the volume they are confined in, to get the pressure and the temperature.
However, people are taking the first approach in an attempt to understand the brain. They want a ‘wiring diagram’ of the brain. e. g. a list of every neuron and for each neuron a list of the other neurons connected to it, and a third list for each neuron of the neurons it is connected to. For the non-neuroscientist — the connections are called synapses, and they essentially communicate in one direction only (true to a first approximation but no further as there is strong evidence that communication goes both ways, with one of the ‘other way’ transmitters being endogenous marihuana). This is why you need the second and third lists.
Clearly a monumental undertaking and one which grows more monumental with the passage of time. Starting out in the 60s, it was estimated that we had about a billion neurons (no one could possibly count each of them). This is where the neurological urban myth of the loss of 10,000 neurons each day came from. For details see https://luysii.wordpress.com/2011/03/13/neurological-urban-legends/.
The latest estimate [ Science vol. 331 p. 708 ’11 ] is that we have 80 billion neurons connected to each other by 150 trillion synapses. Well, that’s not a mole of synapses but it is a nanoMole of them. People are nonetheless trying to see which areas of the brain are connected to each other to at least get a schematic diagram.
Even if you had the complete wiring diagram, nobody’s brain is strong enough to comprehend it. I strongly recommend looking at the pictures found in Nature vol. 471 pp. 177 – 182 ’11 to get a sense of the complexity of the interconnection between neurons and just how many there are. Figure 2 (p. 179) is particularly revealing showing a 3 dimensional reconstruction using the high resolutions obtainable by the electron microscope. Stare at figure 2.f. a while and try to figure out what’s going on. It’s both amazing and humbling.
But even assuming that someone or something could, you still wouldn’t have enough information to figure out how the brain is doing what it clearly is doing. There are at least 6 reasons.
l. Synapses, to a first approximation, are excitatory (turn on the neuron to which they are attached, making it fire an impulse) or inhibitory (preventing the neuron to which they are attached from firing in response to impulses from other synapses). A wiring diagram alone won’t tell you this.
2. When I was starting out, the following statement would have seemed impossible. It is now possible to watch synapses in the living brain of awake animal for extended periods of time. But we now know that synapses come and go in the brain. The various papers don’t all agree on just what fraction of synapses last more than a few months, but it’s early times. Here are a few references [ Neuron vol. 69 pp. 1039 – 1041 ’11, ibid vol. 49 pp. 780 – 783, 877 – 887 ’06 ]. So the wiring diagram would have to be updated constantly.
3. Not all communication between neurons occurs at synapses. Certain neurotransmitters are generally released into the higher brain elements (cerebral cortex) where they bathe neurons and affecting their activity without any synapses for them (it’s called volume neurotransmission) Their importance in psychiatry and drug addiction is unparalleled. Examples of such volume transmitters include serotonin, dopamine and norepinephrine. Drugs of abuse affecting their action include cocaine, amphetamine. Drugs treating psychiatric disease affecting them include the antipsychotics, the antidepressants and probably the antimanics.
4. (new addition) A given neuron doesn’t contact another neuron just once as far as we know. So how do you account for this by a graph (which I think allows only one connection between any two nodes).
5. (new addition) All connections (synapses) aren’t created equal. Some are far, far away from the part of the neuron (the axon) which actually fires impulses, so many of them have to be turned on at once for firing to occur. So in addition to the excitatory/inhibitory dichotomy, you’d have to put another number on each link in the graph, about the probability of a given synapse producing and effect. In general this isn’t known for most synapses.
6. (new addition) Some connections never directly cause a neuron to fire or not fire. They just increase or decrease the probability that a neuron will fire or not fire with impulses at other synapses.These are called neuromodulators, and the brain has tons of different ones.
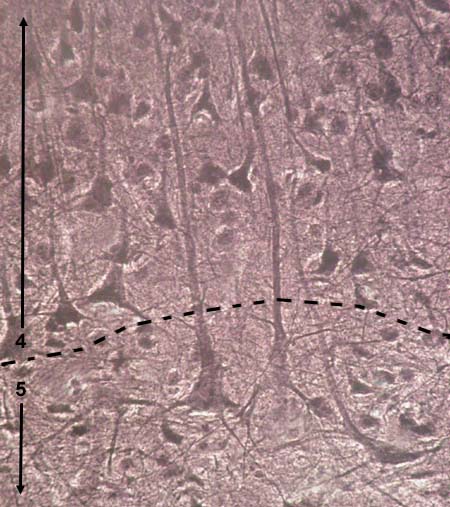
Statistical mechanics works because one molecule is pretty much like another. This certainly isn’t true for neurons. Have a look at http://faculties.sbu.ac.ir/~rajabi/Histo-labo-photos_files/kora-b-p-03-l.jpg. This is of the cerebral cortex — neurons are fairly creepy looking things, and no two shown are carbon copies.
The mere existence of 80 billion neurons and their 150 trillion connections (if the numbers are in fact correct) poses a series of puzzles. There is simply no way that the 3.2 billion nucleotides of out genome can code for each and every neuron, each and every synapse. The construction of the brain from the fertilized egg must be in some sense statistical. Remarkable that it happens at all. Embryologists are intensively working on how this happens — thousands of papers on the subject appear each year.
(Addendum 17 July ’14) I’m fortunate enough to have a family member who worked at Bell labs (when it existed) and who knows much more about graph theory than I do. Here are his points and a few comments back
Seventh paragraph: Still don’t understand the purpose of the three lists, or what that buys that you don’t get with a graph model. See my comments later in this email.
“nobody’s brain is strong enough to comprehend it”: At some level, this is true of virtually every phenomenon of Nature or science. We only begin to believe that we “comprehend” something when some clever person devises a model for the phenomenon that is phrased in terms of things we think we already understand, and then provides evidence (through analysis and perhaps simulation) that the model gives good predictions of observed data. As an example, nobody comprehended what caused the motion of the planets in the sky until science developed the heliocentric model of the solar system and Newton et al. developed calculus, with which he was able to show (assuming an inverse-square behavior of the force of gravity) that the heliocentric model explained observed data. On a more pedestrian level, if a stone-age human was handed a personal computer, his brain couldn’t even begin to comprehend how the thing does what it does — and he probably would not even understand exactly what it is doing anyway, or why. Yet we modern humans, at least us engineers and computer scientists, think we have a pretty good understanding of what the personal computer does, how it does it, and where it fits in the scheme of things that modern humans want to do.
Of course we do, that’s because we built it.
On another level, though, even computer scientists and engineers don’t “really” understand how a personal computer works, since many of the components depend for their operation on quantum mechanics, and even Feynman supposedly said that nobody understands quantum mechanics: “If you think you understand quantum mechanics, you don’t understand quantum mechanics.”
Penrose actually did think the brain worked by quantum mechanics, because what it does is nonAlgorithmic. That’s been pretty much shot down.
As for your six points:
Point 1 I disagree with. It is quite easy to express excitatory or inhibitory behavior in a wiring diagram (graph). In fact, this is done all the time in neural network research!
Point 2: Updating a graph is not necessarily a big deal. In fact, many systems that we analyze with graph theory require constant updating of the graph. For example, those who analyze, monitor, and control the Internet have to deal with graphs that are constantly changing.
Point 3: Can be handled with a graph model, too. You will have to throw in additional edges that don’t represent synapses, but instead represent the effects of neurotransmitters.Will this get to be complicated graph? You bet. But nobody ever promised an uncomplicated model. (Although uncomplicated — simple — models are certainly to be preferred over complicated ones.)
Point 4: This can be easily accounted for in a graph. Simply place additional edges in the graph to account for the additional connections. This adds complexity, but nobody ever promised the model would be simple. Another alternative, as I mentioned in an earlier email, is to use a hypergraph.
Point 5: Not sure what your point is here. Certainly there is a huge body of research literature on probabilistic graphs (e.g., Markov Chain models), so there is nothing you are saying here that is alien to what graph theory researchers have been doing for generations. If you are unhappy that we don’t know some probabilistic parameters for synapses, you can’t be implying that scientists must not even attempt to discover what these parameters might be. Finding these parameters certainly sounds like a challenge, but nobody ever claimed this was an un-challenging line of research.
In addition to not knowing the parameters, you’d need a ton of them, as it’s been stated frequency in the literature that the ‘average’ neuron has 10,000 synapses impinging on it. I’ve never been able to track this one down. It may be neuromythology, like the 10,000 synapses we’re said to lose every day. With 10,000 adjustable parameters you could make a neuron sing the Star Spangled Banner. Perhaps this is why we can sing the Star Spangled Banner.
Point 6: See my comments on Point 5. Probabilistic graph models have been well-studied for generations. Nothing new or frightening in this concept.
